
2.2.2 Metrics based on more complex calculations
Here I only provide the basic calculations of each metric. For a more extensive explanation of these metrics as well as an evaluation of their advantages and disadvantages, see Section 1.4 Citation Metrics.
h-index and related parameters
The h-index was proposed by Hirsch (2005). It is defined as follows:
A scientist has index h if h of his/her Np papers have at least h citations each, and the other (Np-h) papers have no more than h citations each.
For instance, an academic has a h-index of 20 if 20 of his/her papers have at least 20 citations each and his/her other papers have no more than 20 citations each. The h-index cannot be larger than the number of papers and academic has published.
Publish or Perish calculates and displays the h index proper, its associated proportionality constant a (from Nc,tot = ah2), and the rate parameter m (from h ~ mn, where n is the number of years since the first publication).
These metrics are shown as h-index, Hirsch a=y.yy, m=z.zz. To see Hirsch a and m, scroll down in the results view.
g-index
The g-index was proposed by Egghe (2006). It is defined as follows:
[Given a set of articles] ranked in decreasing order of the number of citations that they received, the g-index is the (unique) largest number such that the top g articles received (together) at least g2 citations.
For instance, an academic has a g-index of 30 if the top 30 most cited of his/her papers combined have at least 900 citations. It aims to improve on the h-index by giving more weight to highly-cited articles. The g-index cannot be larger than the number of articles and academic has published. This metric is shown as g-index in the output.
e-index
Publish or Perish also calculates the e-index as proposed by Zhang (2009). The e-index is the (square root) of the surplus of citations in the h-set beyond h2, i.e., beyond the theoretical minimum required to obtain an h-index of h.
For instance, if an academic has an h-index of 10, but has a total of 200 citations to the first 10 published articles, his/her e-index would be 10 (the square root of 200 minus the theoretical minimum required to obtain a h-index of 10, i.e. 100).
The aim of the e-index is to differentiate between scientists with similar h-indices but different citation patterns. It is similar in nature to the g-index in that it gives more attention to highly-cited articles. This metric is shown as e-index in the output.
Contemporary h-index
The contemporary h-index was proposed by Sidiropoulos, Katsaros & Manolopoulos (2006).
It adds an age-related weighting to each cited article, giving (by default; this depends on the parameterization) less weight to older articles. The weighting is parameterized; the Publish or Perish implementation uses gamma=4 and delta=1, as the authors did for their experiments.
This means that for an article published during the current year, its citations account four times. For an article published 4 years ago, its citations account only one time. For an article published 6 years ago, its citations account 4/6 times, and so on.
This metric is shown as hc-index and ac=y.yy in the output. To see ac, scroll down in the results view.
Individual h-index (3 variations)
The Individual h-index was proposed by Batista, Campiteli, Kinouchi & Martinez (2006). It divides the standard h-index by the average number of authors in the articles that contribute to the h-index, in order to reduce the effects of co-authorship; the resulting index is called hI.
Publish or Perish also implements an alternative individual h-index, hI,norm, that takes a different approach: instead of dividing the total h-index, it first normalizes the number of citations for each paper by dividing the number of citations by the number of authors for that paper, then calculates hI,norm as the h-index of the normalized citation counts. This approach is much more fine-grained than both Batista et al.'s and Schreibers (see below); I believe that it more accurately accounts for any co-authorship effects that might be present and that it is a better approximation of the per-author impact, which is what the original h-index set out to provide.
The third variation is due to Michael Schreiber (2006). Schreiber's method uses fractional paper counts instead of reduced citation counts to account for shared authorship of papers, and then determines the multi-authored hm index based on the resulting effective rank of the papers using undiluted citation counts.
These metrics are shown as hI-index (Batista et al.'s), hI,norm (PoP's) and hm-index (Schreiber's) in the output.
Age-weighted citation rate (AWCR, AWCRpA) and AW-index
The age-weighted citation rate was inspired by Bihui Jin (2007). The AWCR measures the number of citations to an entire body of work, adjusted for the age of each paper. It is an age-weighted citation rate, where the number of citations to a given paper is divided by the age of that paper. Jin defines the AR-index as the square root of the sum of all age-weighted citation counts over all papers that contribute to the h-index.
However, in the Publish or Perish implementation we sum over all papers instead, because we feel that this represents the impact of the total body of work more accurately. (In particular, it allows younger and as yet less cited papers to contribute to the AWCR, even though they may not yet contribute to the h-index.)
The AW-index is defined as the square root of the AWCR to allow comparison with the h-index; it approximates the h-index if the (average) citation rate remains more or less constant over the years. The per-author age-weighted citation rate is similar to the plain AWCR, but is normalized to the number of authors for each paper.
These metrics are shown as AWCR, AWCRpA and AW-index in the output.
Worked example: what can one conclude from complex metrics?
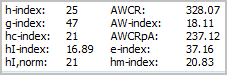
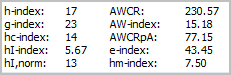
Here I return the publication records of me and my colleague. We have similar levels of total citations (2334 vs 2219) and have been active for a similar number of years (16 vs 14). This time I show the more complex metrics. What can we conclude from these?
 |
 |
h-index
First my record shows a higher h-index than that of my colleague. This is not surprising, given that as we have seen above she has published far fewer papers and hence it is more difficult for her to achieve a high h-index. In her case, only six of her papers are not included in the h-index. In my case, this is true for nearly two-thirds of my papers.
g-index
My g-index is twice as high as that of my colleague. The simple reason is that neither the g-index nor the h-index can be higher than the total number of papers published and my colleague has only published 23 papers so far. Hence, the maximum her g-index can reach is 23. Even if she would publish another paper without any citations, her g-index would still increase. This is clearly a limitation of the g-index.
hc-index
Our reduction in hc-index when compared to the regular h-index is very similar (16-18%), reflecting the similarity of our career stage. Our e-index is also fairly similar, indicating that our number of excess citations over and above what would be the minimum necessary to achieve our regular h-index is also similar.
Individual h-index
The three different versions of the individual h-index, however, provide very different results. For the PoP implementation (hI,norm), our reduction in comparison to the regular h-index is again fairly similar (16-24%). For the two other implementations (hI-index and hm-index) my individual h-index is still fairly similar to hI,norm (16.89 and 20.83 versus 21), but for my colleague it is much lower (5.57 and 7.50 versus 13).
The reason is that the two other implementations include a far stronger “punishment” for co-authorship. The hI,norm only reduces the number of citations for each paper by accounting for the number of co-authors. This means that papers with a large number of citations can still be included in the h-index if their number of citations after co-author correction is high enough. For authors with a high e-index, this will generally be the case for a substantial number of their papers.
On the other hand, the hI-index simply divides the regular h-index by the total number of authors contributing to the h-index. As my colleague has only one single-authored article and many articles with three or four authors, her hI-index is very low when compared to her regular h-index. Although this is not the case for my colleague, theoretically the hI-index could be brought down by modestly cited articles with a large number of co-authors, even though most of the authors highly cited articles are single-authored.
The hm index converts each paper to a fractional paper count, so that a paper with three authors only counts for 0.33 towards the h-index and a paper with four authors for 0.25. Given that my colleague has many papers with three or four authors, her resulting hm index is fairly low. In fact my hm index is nearly three times as high as hers, even though my regular h-index is only 1.5 times as high.
Someones preference for one of these three individual h-indices depends on the importance one places on single-authored papers. I would argue that the hI,norm is closest to the initial philosophy of the h-index by focusing on citations, rather than on papers.
AWCR
Even though our total numbers of citations are fairly similar, my colleagues AWCR which takes a “total body of work perspective” is a bit lower. The reason for this is the AWCRs correction for the age of papers. Most of my colleagues most highly cited papers are fairly old (around 10 years), whilst in addition to older papers, I also have a number of recent papers that have already accumulated a large number of citations. Finally, my AWCRpA metric is nearly three times as high as that of my colleague. This is caused purely by the fact that she has generally published with a larger number of co-authors.
Conclusions
Hence, overall the conclusions are not dissimilar from our earlier analysis based on much simpler metrics. My colleague has published a smaller number of papers that on average have more impact and has published with a larger number of co-authors. This does show that simple metrics can in fact already go a long way.